About two hundred thousand years ago our history began. Number of participants: One hundred fifty thousand. Setting: Africa [1]. The explosive eruption of the supervolcano Toba on the island of Sumatra in 72,000 B.C. marks a more precise date [2]. Ashes darkened the sun and the fall-out covered an area bigger than Europe. A winter followed, lasting several years we are told. DNA research [3,4] brings us to the same point in time and it suggests also that: 1) The Toba eruption was a disaster for our species, bringing us on the brink of extinction and reducing our numbers by a factor of ten. The early survival success of the hunter-gatherers – mainly due to their power of speech – was annihilated in one single blow and the population in Africa was reduced to a number not bigger than 10,000. 2) A small group of no more than 150 individuals left East-Africa some thousand years after the vulcanic eruption and their descendants populated the earth. For a 'Map of Human Migration click here. For an overview of the various earlier migrations out of Africa of early humans click here.
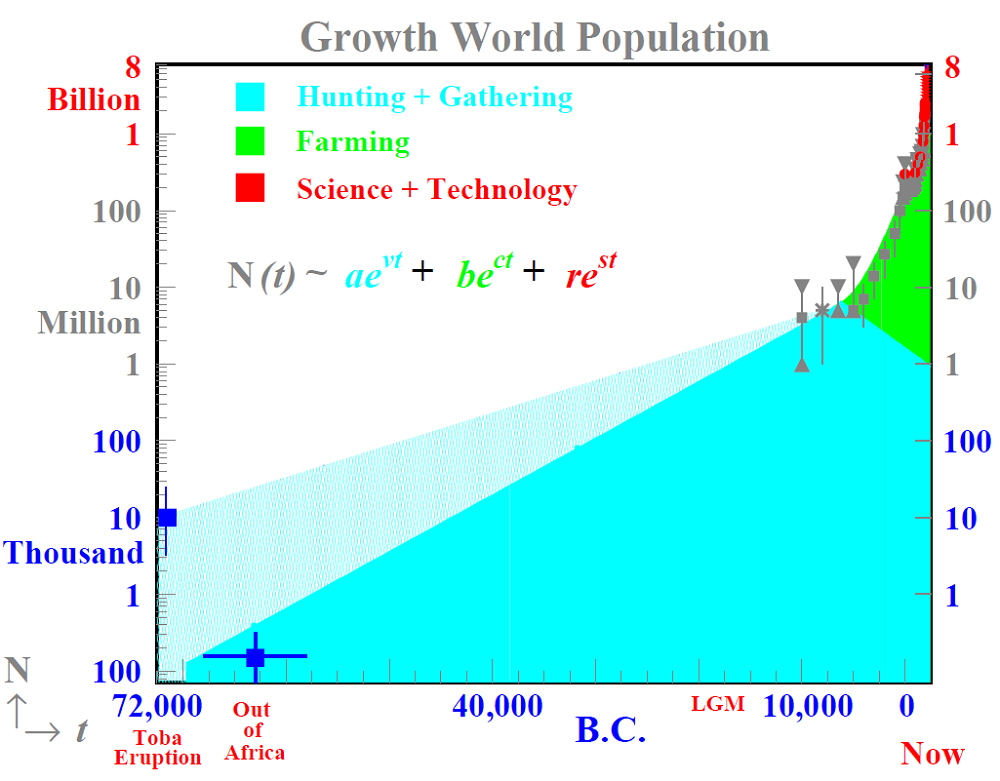 By 10,000 B.C. our species had increased to a number between one and ten million. In the figure "Growth World Population" this jump in our numbers is visualised. Vertically the numbers of homo sapiens with their numerical uncertainties are plotted logarithmically. Time runs along the horizontal scale, we use the Christian era with its Gregorian calendar (New Style).The increase of the hunter-gatherers is represented by the rising lightblue area up to about 6,000 B.C. The slow decrease of this mode of existence since then is schematically indicated by the descending line to the one million tick mark at present. Apart from the estimate at the time of the Toba eruption, the data are taken from a table on the website of the US Census Bureau [5]. The development of the numbers as function of time is approximated by a sum of three independent exponential functions, the population curve N(t), where t stands for time. In the figure with its logarithmic vertical scale these functions, also called powers of e, form straight lines and their areas are indicated with different colours.
After 6,000 B.C. up to the present our totals multiply again with a factor thousand and two separate processes are responsible for this dramatic increase. The exponential growth, triggered by the agricultural revolution which started eight to seven millennia ago, is responsible for the increase to six hundred million by 1600 A.D. This process is indicated in the figures by the green colour.
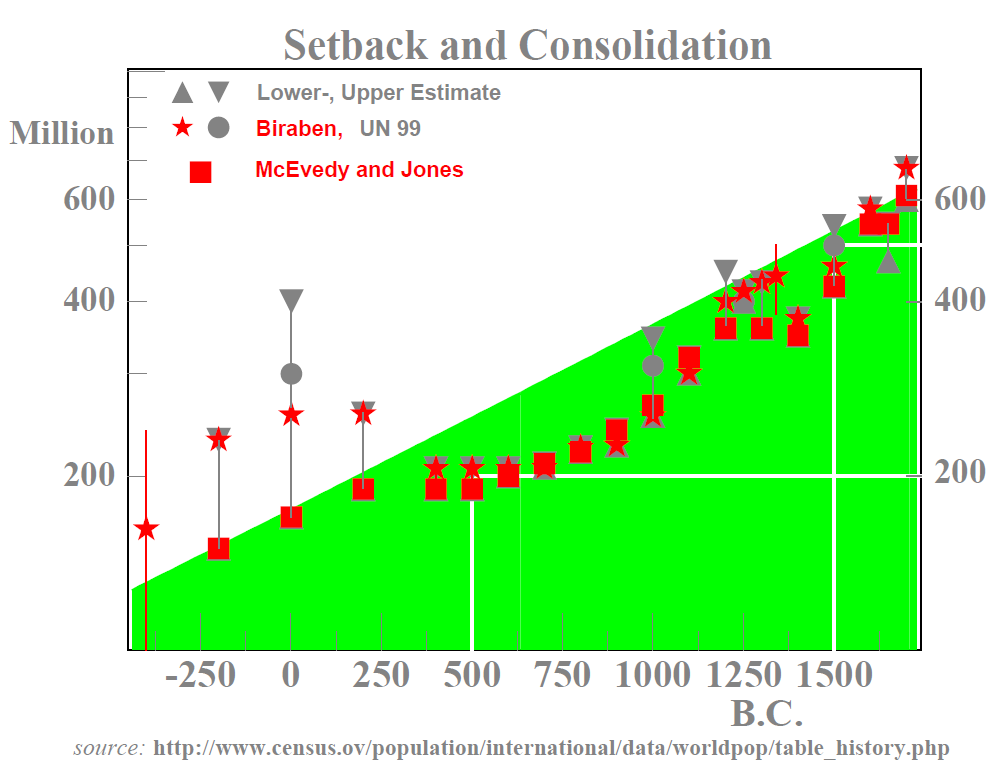 In the figure "Setback and Consolidation" part of the data for the agricultural period is plotted. The number of hunter-gatherers is too small to appear on the range of the vertical scale shown. Noticeable is the possible decrease at the start of the first millennium. Year 1 has attracted many Western demographers with nine different determinations. As the spread in the results is large, it remains unclear whether a large drop in population occurred around that year or the exponential rise gradually changed into a more constant development. Most of the other data of the figure are obtained by two groups and large systematic uncertainties cannot be excluded. However the obvious fact staring one in the face and begging for an explanation is the constancy of the population in the main part of the first millennium of Christianity. Be aware though, o reader, that Asia contains about 60% of the total in the years shown and Europe less than 20%. By 1500 the total reaches the curve again and the exponential growth resumes its course.
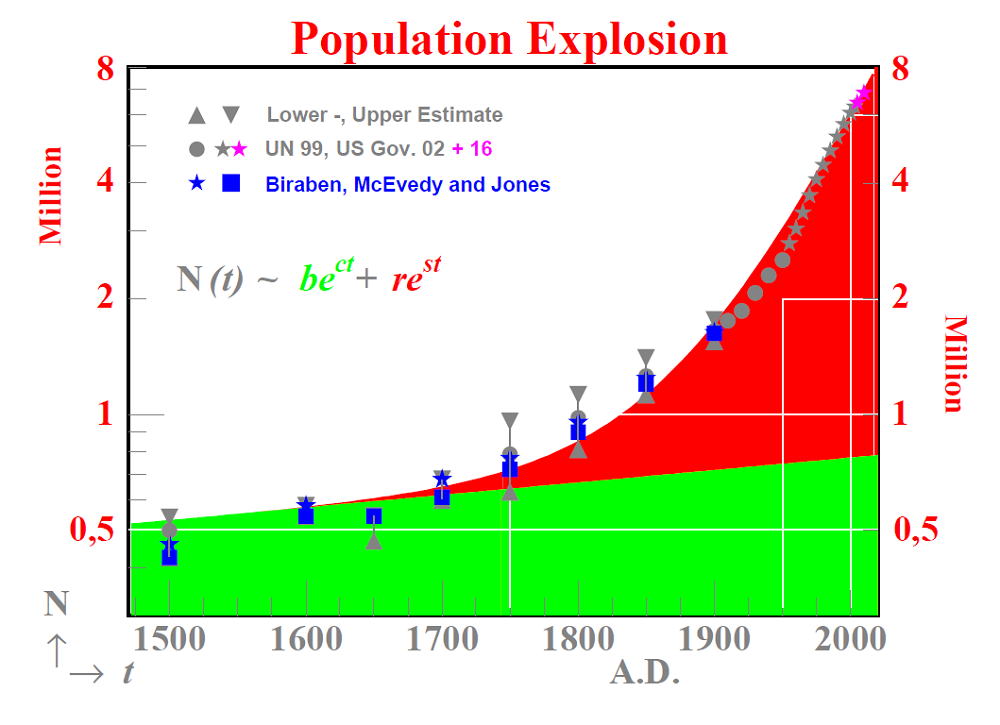 The most recent leap forward is shown in the figure "Population Explosion". The red area shows the contribution associated with the "scientific revolution", which started in the sixteenth century. The sum of the two exponentials describe the data remarkably well and by 1880 their contributions are equal and about 0.7 billion. In the first half of the twentieth century the total increases less than the sum of both powers. A litany of disasters responsible for this slowdown of the explosion runs as follows: Western colonial exploitation on various continents, a stagnating and powerless China, the Great War, the Spanish flu, the rule of Mussolini, Stalin, Hitler and Franco in Europe, and the aggressive Japanese expansion attempts in the Far East. After the second world war an accelerated growth sets in. By 1980 the population curve is reached again and in 2000 the six billion mark is passed. The contribution of the green curve is by then reduced to only 10%. The constants which determine the contributions of the two exponential functions of t, b and c, and r and s are chosen such that the increase due to the agricultural revolution in the sixth millennium B.C., the low value in the year 1 and the data of 1600 and 2000 are well described.
A clear deviation from the exponential increase is predicted by the US Census Bureau for the first half of the twenty first century and the onset of this change occurred almost forty years ago. In the figure "Growth" the yearly growth (circles and linear vertical scale on the left in percent) as well as the total number of humans (stars and logarithmic scale on the right in billions) are shown for the period 1950 - 2050. 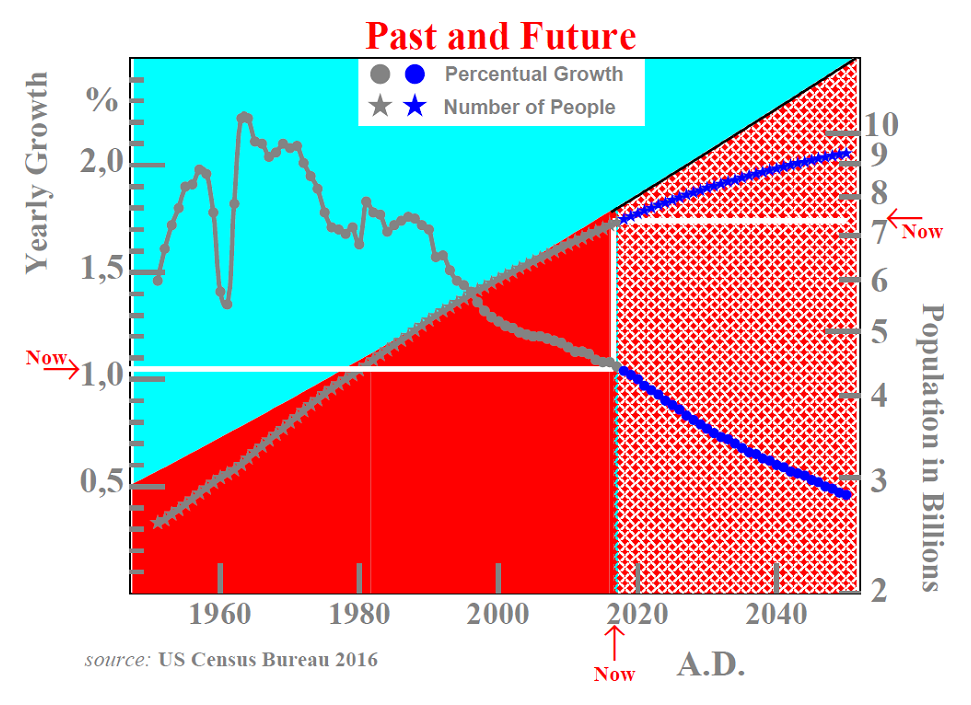 After the second world war the growth increased rapidly to 2% in 1958. The period of the "Great Leap Forward" in China from 1958 to 1962 with its tens of millions of victims reversed the trend temporarily with a measurable drop to 1.3%. Shortly afterwards, in the midst of the sixties a maximum is reached of about 2.1%, then a slow decrease sets in. This decrease is due to the reduction in the number of surviving children per woman, the fertility, thanks to the spread and use of birth control techniques. An average of three is reached in 2000, and in the estimates shown [4] this average decreases to two in 2050.
The next half century is summarised with a plot of the birth and death rates per second and their difference, the growth (an astronomical year counts 31.6 million seconds). 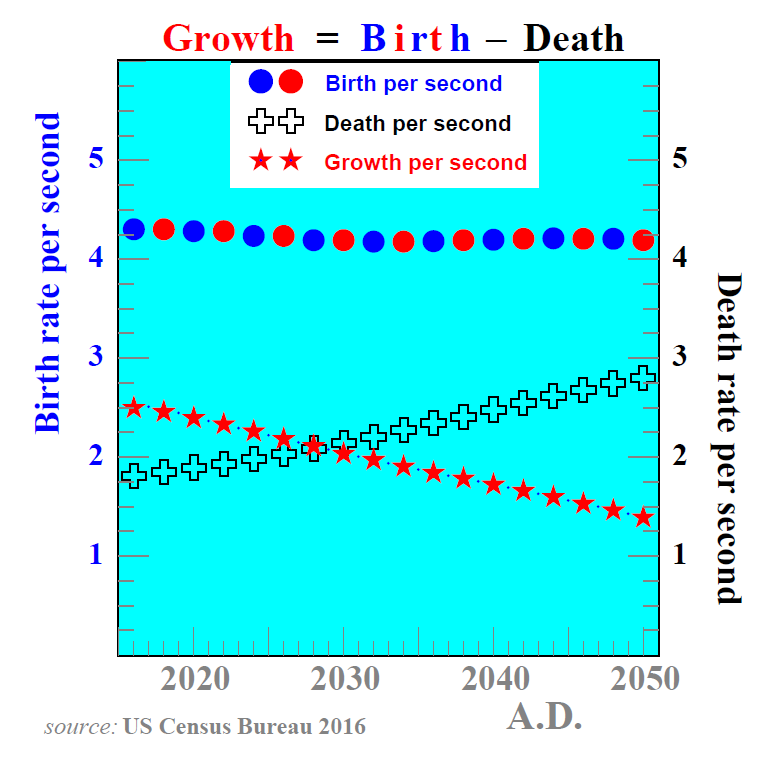 The steady decline in growth, due to the increasing death rate in an aging world population leads to a growth of one and a half of our kind per second around 2050. Within this scenario a stable total of about 10 billion is reached at the end of the century, with four babies being born and four humans dying every second. In my view a decrease, thus a negative growth, should be preferred, leading hopefully to a total, in equilibrium with an abondance of species in the wild - on land, at sea and in the air - with whom we share "the adventure of life". What criteria to use to determine that lower total number? How to reach it? How to organise a common retreat from the alleged paradises of economic growth and consumer well being as preached by the powers that be? Or is it too late? Has the tide already turned and is the future outside our control?
Amsterdam, 1 February 2004
P. Duinker
Afterword:
An older colleague found my conclusion 'romantic'. At present – 13 years later – I happen to agree with him. A balanced paradisaical state of affairs will not occur and an end due to self-poisoning –– as in a culture of microbes – is thinkable.
30 August 2017
In separate windows the data for three different time slices and an overview are shown in more detail: 1) 10.000 B.C. - 500 A.D., 2) 400 B.C. - 1600 A.D. , 3) 1500 - 2000 and 4)Overview. For a more sophisticated mathematical treatment of the human population problem see the paper by Sergei T. Kapitza [6] and references therein.
References
1. Diamond, J. GUNS, GERMS and STEEL (London: Vintage,1998). The prologue of this book gives a good overview of the literature on the subject of early humans as known at the end of the previous century. The point in time of our appearance outside Africa is still best described as 70,000 to 60,000 years ago.
2. Ambrose, Stanley H. Late Pleistocene human population bottlenecks, volcanic winter, and differenciation of modern humans. Journal of Human Evolution 35(1998)115-118
Supervolcanoes, BBC2 9:30pm Thursday 3rd February 2000, Transcript of the Horizon program.
Shindell D. Super-Eruptions, Climate and Human Survival NASA Science Brief, GISS, July 2009.
3. Behar et al., The dawn of human matrilineal diversity, The American Journal of Human Genetics (2008), doi:,1016/j.ajhg.2008.04.002.
4. Map of Human Migration.: Zie voor een overzicht over dit onderwerp voor niet-specialisten een artikel in: For a discussion for non-specialists see 'The National Geographic's Genographic Project': Map of Human Migration.
4. An exception are the descendants of the slave-trade to in historical order the Middle East and South and North America respectively.For a Wikipedia webpage on the subject click here.
5.US Census Bureau, Historical Estimates of World Population.
6. Kapitza, S. T.,The phenomenological theory of world population growth, http://srs.dl.ac.uk/SPEAKERS/KAPITZA/Uspekhi_96.html.
| HOME | PRINT VERSION | MARK-J |