80M Band Pass Filter
Series-Trap, Shunt-C filter topology is used. Just 3 sections are enough to obtain more than sufficient image rejection. The filter design is based on a 0.1dB ripple Chebyshev response. The schematic is shown in the following drawing:
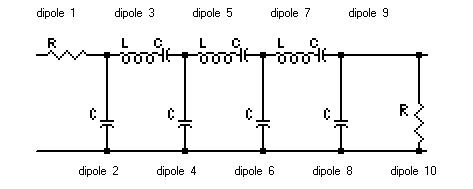
Because of design constraints, especially regarding IMD, the following theoretical and practical component values are chosen:
| 80M BPF, Fc=3750KHz, BW=836KHz, Ql=4.49 |
| Dipole |
Design |
Implementation |
Inductor |
| R (ohm) |
L (uH) |
C (pF) |
R (ohm) |
L (uH) |
C (pF) |
C (pF) ATC |
Core |
# turns |
wire (mm) |
| 1 |
50 |
|
|
50 |
|
|
|
|
|
|
| 2 |
|
|
329 |
|
|
270 |
270 |
|
|
|
| 3 |
|
12.4 |
181 |
|
11.9 |
180 |
180 |
T94-6 |
40 |
0.65 |
| 4 |
|
|
1030 |
|
|
1000 |
1000 |
|
|
|
| 5 |
|
12.4 |
202 |
|
11.9 |
180 + 22 |
200 |
T94-6 |
40 |
0.65 |
| 6 |
|
|
1030 |
|
|
1000 |
1000 |
|
|
|
| 7 |
|
12.4 |
181 |
|
11.9 |
180 |
180 |
T94-6 |
40 |
0.65 |
| 8 |
|
|
329 |
|
|
270 |
270 |
|
|
|
| 10 |
50 |
|
|
50 |
|
|
|
|
|
|
Dipole 1 and 10 represent the filters input and output impedance in the simulation and are not physically present in the real circuit. The practical capacitors are made up from combinations of standard values. The first column shows the values I used with Polystyrene capacitors. The other column shows values when ATC100-B chip capacitors are used. The inductors are fine tuned by changing the distribution of turns around the toroid.
Dipole 2 and 8, that match the filter to 50 ohms, have been reduced by about 50pF in order to compensate for the parasitic capacitance of the complete motherboard system.
In simulation when the coils are modeled with a Q=200 the filter has the following key characteristics:
-
Insertion loss: 0.50dB
-
Image rejection at 21.5MHz: 133dB (!)
-
IF rejection at 9MHz: 81dB
-
-3dB bandwidth: 800KHz
-
Center frequency: 3750KHz
-
Loaded Q: 4.69
The 133dB image rejection at 21.5MHz is theoretical and will probably not be realized in real life. The IF rejection at 9MHz is not sufficient by itself. The H-Mode mixer's symmetry and the 9MHz notch filter will add more than enough extra attenuation.
IMD comparison
Because of the IMD requirement a number of Micrometals toroids have been tested: T68-6, T80-6 and T94-6. The resulting inductors have been tested with the same filter assembly utilizing Suflex 2.5% polystyrene capacitors.
The table below summarizes the filter measurement data. The 2-tones have 20KHz separation. IMD is measured at 0dBm and 5dBm input levels to detect non 3rd order law behavior. MDS is measured within 2.2KHz bandwidth:
| 80M BPF IMD comparison, FSA3157 + T1-6T mixer, QT roofing filter |
| Core |
|
IIP3 2-tone level 0dBm |
IIP3 2-tone level 5dBm |
| IL |
MDS |
BPF |
-BPF |
+BPF |
IMD3DR |
BPF |
-BPF |
+BPF |
IMD3DR |
| (-dB) |
(-dB) |
(dBm) |
(dBm) |
(dBm) |
(dB) |
(dBm) |
(dBm) |
(dBm) |
(dB) |
| T94-6 |
0.56 |
133 |
50.0 |
50.0 |
49.8 |
121.8 |
50,3 |
50.0 |
50.3 |
122.2 |
| T80-6 |
0.60 |
133 |
49.2 |
51.2 |
46.7 |
119.8 |
50.5 |
50.7 |
47.0 |
120.0 |
| T68-6 |
0.60 |
133 |
43.7 |
51.2 |
42.0 |
116.6 |
44.5 |
50.7 |
42.2 |
116.8 |
The table requires some explanation. For each core the insertion loss of the resulting BPF and the MDS figure for the complete frontend with that BPF is given. Next, IMD results at 0dBm input tones and 5 dBm input tones are given. The columns marked 'BPF' show the IIP3 of the BPF only. The columns marked '-BPF' show the IIP3 of the frontend without the BPF in front and the columns marked '+BPF' show the IIP3 of the complete frontend including the BPF. Also the IMD3 dynamic range is computed and shown.
A number of additional remarks to the measurements:
-
All measurements are done with the complete BPF motherboard with 10 BPF filters, notch filter and the attenuator board mounted. So the IL and MDS figures include the small but measurable additional losses (about 0.2dB) introduced by the attenuator board (4 relays), the 9MHz notch and the 2 relays on the measured BPF board.
-
On 80M the additional loss in the IF notch filter can be neglected.
-
All tested toroids give good results on 80M, but only the biggest toroids match the performance of the mixer.
-
On 80M bigger toroids obviously mean less IMD. T94-6 is the best choice.
-
The obtained inductor Q with the tested toroids seems to be around 200. Standard 0,65mm enameled wire is used. There is no need at all to use litze wire to reduce skin effect losses with the tested toroids.
80M BPF with T94-6
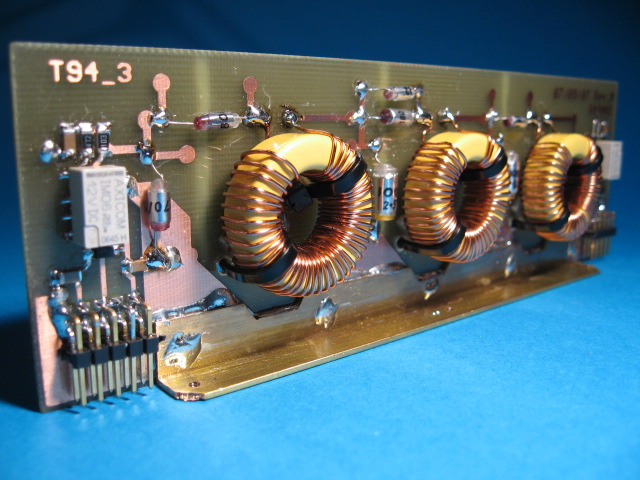
All tested toroids perform rather well. My favorite however is the BPF build-up with the T94-6, marked with cyan in the table. A picture of the assembled filter PCB is shown below. It measures 160x50mm, a half height eurocard. The assembly is meant to be plugged onto a motherboard with 9 other similar BPF's and a 9MHz notch filter board:
Measurement overview
The following table summarizes some measurements made to the T94-6 80M BPF:
| 80M BPF results, FSA3157 + T1-6T mixer, QT roofing filter |
| BPF Filter Center |
3750 |
KHz |
| BPF -3dB Band Width |
836 |
KHz |
| BPF Loaded Q |
4.5 |
|
| BPF Insertion loss |
-0.56 |
dB |
| MDS level without BPF |
-134 |
dBm |
| MDS level with BPF |
-133 |
dBm |
| IP3 frontend without BPF @ 0dBm |
+50.0 |
dBm |
| IP3 of BPF only @ 0dBm |
+50.0 |
dBm |
| IP3 of frontend with BPF @ 0dBm |
+49.8 |
dBm |
| IMD3 dynamic range @ 0dBm |
121.8 |
dB |
| Image rejection @ 21.5MHz |
-105 |
dB |
| BPF box IF rejection @ 9MHz @ 0dBm |
-117 |
dB |
Single tone spurious responses
The following table shows the relevant single tone spurious responses of the H-Mode mixer frontend with the 80M BPF. Spurious signals are determined by the following equation: | n * Fo ± m * Fs | = Fif, where n = 0, 1, 2, 3, 4, 5 and m = 1, 2, 3, 4, 5. The number of possible spurs up to 5'th order is 55, but only those that fall within the -40dB pass band of the BPF are investigated. Higher order spurs and spurs outside the -40dB pass band are considered insignificant and have not been measured. The spur test signal is a very strong 0dBm (S9+73dB!) signal.
| 80M BPF + frontend single-tone spurious responses at 3.750.000Hz, @ 0dBm input level |
| Description |
Order: (n,m) |
F-spur (Hz) |
level (dBm) |
| IF |
(0,1) |
9.000.000 |
< -127 |
|
(0,2) |
4.500.000 |
-117 |
|
(0,3) |
3.000.000 |
< -127 |
|
(0,4) |
2.250.000 |
< -127 |
| Image |
(1,1) |
21.750.000 |
-105 |
|
(1,5) |
4.350.000 |
-120 |
|
(2,4) |
4.125.000 |
< -117 |
|
(2,5) |
3.300.000 |
< -120 |
The cyan colored measurements are limited due to the phase noise levels of the signal generator and / or LO. The given values are the best that could be done.
The (0,3) and (0,4) spurs are below the noise floor which is important as these spurs are independent of the tuning frequency! The (0,2) spur is not attenuated enough by the BPF to be completely eliminated at the 0dBm test tone level, but it is very weak.
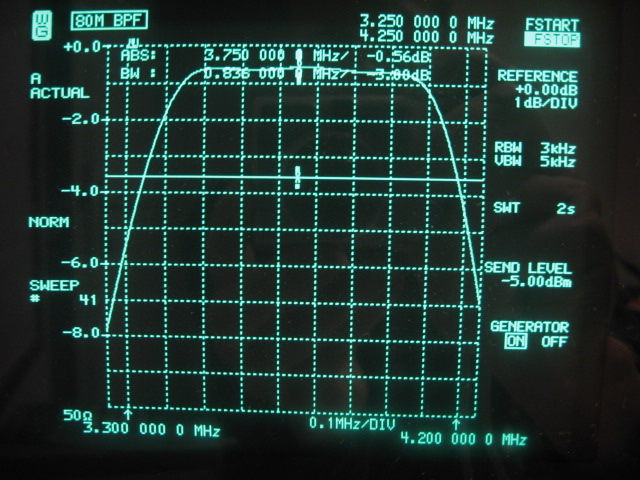
Transmission
The next analyzer plot shows the pass band characteristics of the T94-6 80M filter. IL is around 0.60dB over the entire 80M band at a -3dB bandwidth of 836KHz. The value of the IL indicates that the Q's of the inductors are close to about 200:
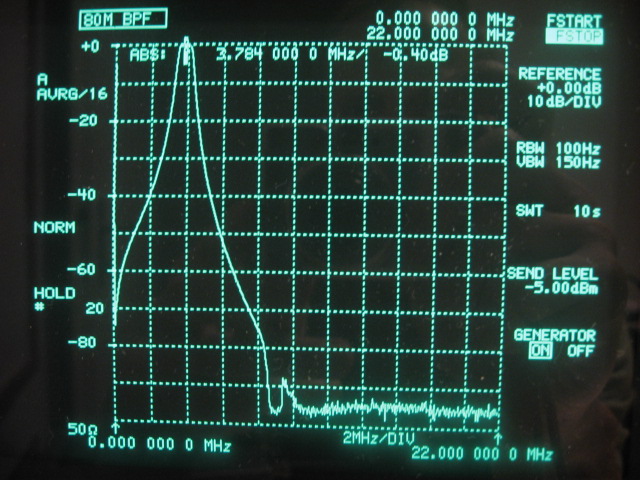
The following analyzer plot shows the wideband insertion loss up to the image frequency at 21.5MHz. The action of the notch filter can be clearly seen close to the noise floor and the filter stop band settles at the analyzer -100dB limit.
The 9MHz IF rejection is measured at < -130dB (not measurable), with the 9MHz notch in place. The image rejection is measured at -105dB.
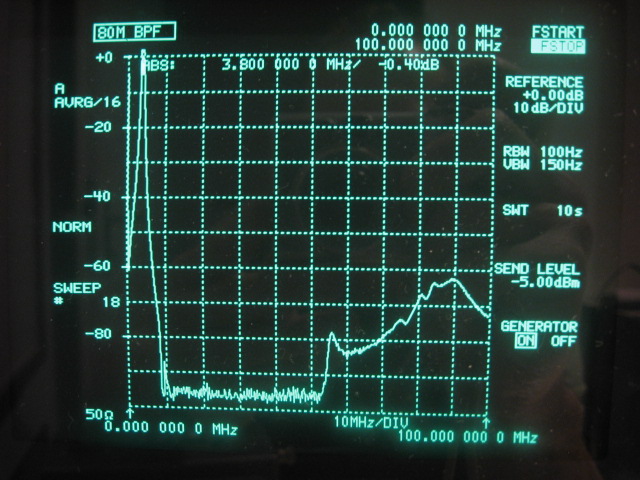
The following analyzer picture is a wideband plot up to 100MHz. Stop band reduces abruptly beyond 55MHz. Probable causes are self resonance of the big toroid inductors and / or resonance of the entire filter slot as a cavity resonator. With a pure enough LO signal this reduced stop band performance at those frequencies should not be of much concern.
Reflection
Finally the impedance of the filter is measured with N2PK-VNA and Exiter software:
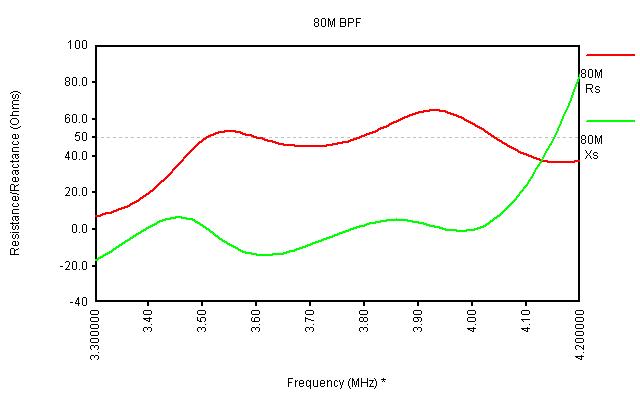
The measured curve almost overlaps the curve when simulating the theoretical filter and shows a good match to a 50 ohm system.
PCB artwork and schematic for the 3-pole filter board in PDF format.
160M BPF
40M BPF
30M BPF
20M BPF
17M BPF
15M BPF
12M BPF
10M BPF
6M BPF
Back to BPF Boards
Back to the TOC
|