|
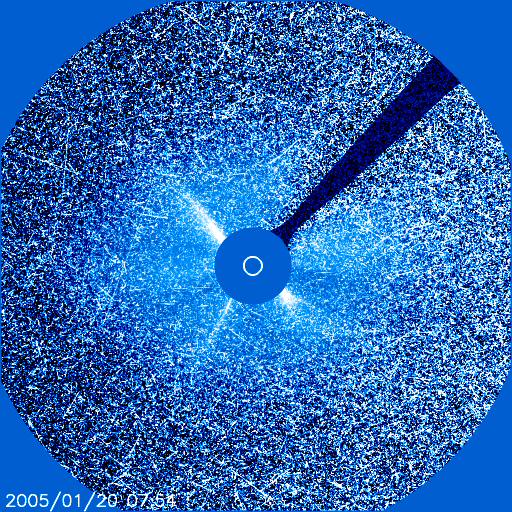
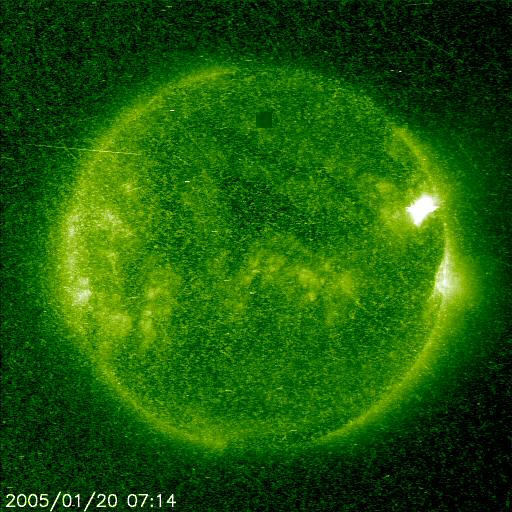
Hallo allemaal,

Afgelopen dagen hebben we niet echt geluk gehad. Zowel het noorderlicht als het
weer lieten verstek en dus was er helaas niets te zien. De zonnevlammen hebben
uiteindelijk wel een langdurige magnetische storing teweeg gebracht, maar deze
was te klein om het aurora boven Nederland op te laten lichten.

Op dit moment is het magneetveld van de aarde weer rustig. Echter, inmiddels
hebben er twee nieuwe krachtige zonnevlammen plaatsgevonden. Helaas zit de
zonnevlek nu op de rand van de zonneschijf, op het punt om naar de achterkant te
verdwijnen. De uitbarstingen zijn daarom meer zijwaarts gericht en niet op de
aarde. Toch is er kans dat we misschien een graantje meepikken en dat een deel
van de wolk geladen zonnedeeltjes onze planeet treft. Dit zou dan vandaag of
morgen moeten gebeuren.

Over de eerste uitbarsting is het volgende bekend: Als deze de aarde treft, dan
wordt de kracht op 3 geschat op een schaal van 1 tot 9. Dit is dus niet erg
hoog. Als dit iets veroorzaakt dan krijgen we misschien vannacht noorderlicht.
De kans bedraagt ongeveer 10%. Over de tweede uitbarsting is nog niet veel
bekend, maar deze kan morgennacht eventueel voor noorderlicht zorgen.

Mocht er iets gaan gebeuren, dan proberen wij u zo snel mogelijk op de hoogte te
brengen.

Groeten,

Roy Keeris


De Noorderlicht discussie groep.
http://groups.yahoo.com/group/noorderlicht
De Noorderlicht chat groep.
http://chat.poollicht.nl

Belangrijke meldingen worden in de alertlijst gedaan.
http://groups.yahoo.com/group/noorderlicht_alert
Realtime site.
http://nu.poollicht.nl

Meer informatie op:
http://www.poollicht.nl
http://www.poollichtmonitor.tk
http://www.poollicht.tk
Definition of an X-RAY BURST.
A temporary enhancement of the X-ray emission of the sun. The time-intensity profile of
soft X-ray bursts is similar to that of the H-ALPHA profile of an associated FLARE.
Definition of the X-RAY FLARE CLASS.
Rank of a FLARE based on its X-ray energy output. Flares are classified by the order of
magnitude of the peak burst intensity (I) measured at the earth in the 1 to 8 angstrom
band as follows:
Class          (in Watt/sq. Meter)
B              I less than (l.t.) 10.0E-06
C              10.0E-06 l.e.= I  l.t.= 10.0E-05
M              10.0E-05 l.e.= I  l.t.= 10.0E-04
X              I g.e.= 10.0E-04
Definition of H-ALPHA.
This ABSORPTION LINE of neutral hydrogen falls in the red part of the visible spectrum
and is convenient for solar observations. The H-alpha line is universally used for
patrol observations of solar flares.
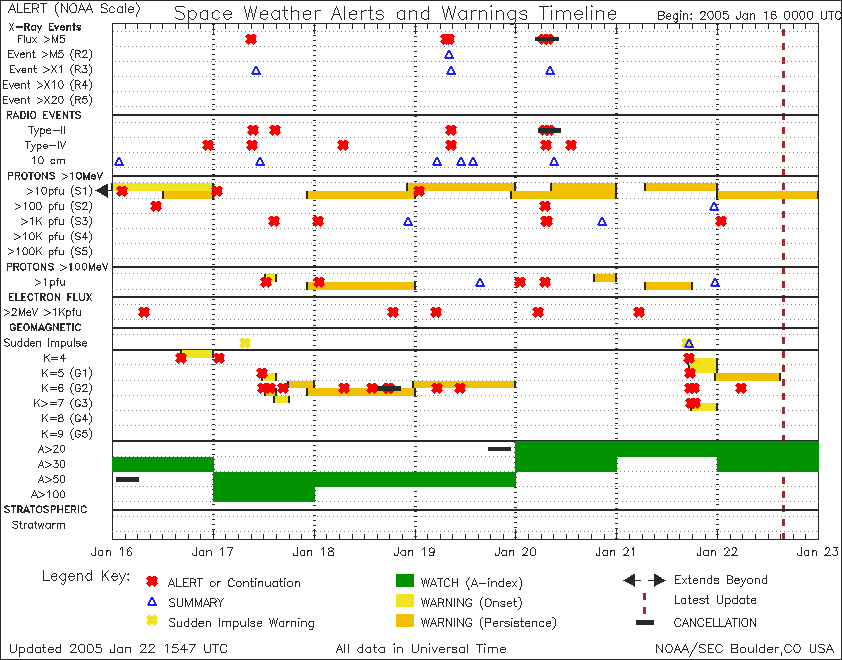
Definition of a PROTON EVENT.
By definition, the measurement of at least 10 protons/sq.cm/sec/steradian at energies greater than 10 MeV.
Definition of a PROTON FLARE.
Any FLARE producing significant FLUXes of greater-than-10 MeV protons in the vicinity of the earth.
Energetic protons can reach Earth within 30 minutes of a major flare's peak. During such an event, Earth is showered with highly energetic solar particles (primarily protons) released from the flare site. Some of these particles spiral down Earth's magnetic field lines, reaching the upper layers of our atmosphere.
From top to bottom, the 4 panels represent the following solar wind proton parameters:
- 1) the bulk speed in kilometers per second
- 2) the density (protons per cm3)
- 3) the most probable thermal speed (km/sec) = Sqrt(2kT/m)
- 4) the flow direction in the plane perpendicular to the ecliptic plane, with positive values indicating flow FROM the south. On rare occassions the spacecraft's roll angle is changed for brief periods, during which the derived flow direction will refer to a different plane. A list of such times is available.
SOHO is never in the magnetosphere and enjoys excellent data coverage. The data on the Web page are typically between a few minutes and a few hours old.
(Electrons)
The Advanced Composition Explorer (ACE) launched at 10:39 a.m., August 25, 1997
Caltech, Pasadena, California, USA
(Protons)
The Advanced Composition Explorer (ACE) launched at 10:39 a.m., August 25, 1997
Caltech, Pasadena, California, USA
(Solar Isotope Spectrometer)
The Solar Isotope Spectrometer (SIS) is designed to provide high resolution measurements of the isotopic composition of energetic nuclei from He to Ni (Z=2 to 28) over the energy range from ~10 to ~100 MeV/nucleon. During large solar events, when particle fluxes can increase over quiet-time values by factors of up to 10000, SIS will measure the isotopic composition of the solar corona.
Caltech, Pasadena, California, USA
(Electron, Proton, and Alpha Monitor)

The Advanced Composition Explorer (ACE) launched at 10:39 a.m., August 25, 1997
Caltech, Pasadena, California, USA
(Magnetometer)
The Solar Wind Electron, Proton, and Alpha Monitor (SWEPAM) measures the solar wind plasma electron and ion fluxes (rates of particle flow) as functions of direction and energy. These data provide detailed knowledge of the solar wind conditions and internal state every minute. SWEPAM also provides real-time solar wind observations which are continiously telemetered to the ground for space weather purposes.
Electron and ion measurements are made with separate sensors. The ion sensor measures particle energies between about 0.26 and 36 KeV, and the electron sensor's energy range is between 1 and 1350 eV. Both sensors use electrostatic analyzers with fan-shaped fields-of-view. The electrostatic analyzers measure the energy per charge of each particle by bending their flight paths through the system. The fields-of-view are swept across all solar wind directions by the rotation of the spacecraft.
Caltech, Pasadena, California, USA
(in Kp units)
The Costello Geomagnetic Activity Index model was developed by Kirt Costello at Rice University under support from the US Air Force and Sterling Software, Inc. It is a neural network algorithm that was trained on the response of the Kp geomagnetic activity index to solar wind parameters. The model takes the most recent two hours of solar wind data and returns a 3-hour activity index prediction in units of Kp. The valid time of the prediction is indicated on the output graphics by horizontal bars.
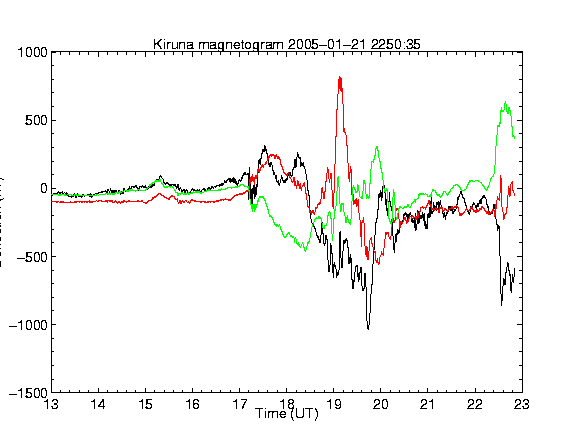
Definition of the K INDEX.
A 3-hourly quasi-logarithmic local index of geomagnetic activity relative to an assumed
quiet-day curve for the recording site. Range is from 0 to 9. The K index measures the
deviation of the most disturbed horizontal component.
Definition of the Kp INDEX.
A 3-hourly planetary geomagnetic index of activity generated in Gottingen, Germany,
based on the K INDEX from 12 or 13 stations distributed around the world.
Kp and its related indices (ap, Ap, Cp) have been widely used in ionospheric and atmospheric studies and are generally recognized as indices measuring the effect of energetic charged particles arriving in Earth's upper atmosphere after periods of intense solar activity.